This page is part of the Da Vinci Data Exchange for Quality Measures (DEQM) FHIR IG (v5.0.0-ballot: STU5 (v5.0.0) Ballot) based on FHIR (HL7® FHIR® Standard) R4. The current version which supersedes this version is 5.0.0. For a full list of available versions, see the Directory of published versions
| Official URL: http://hl7.org/fhir/us/davinci-deqm/ImplementationGuide/hl7.fhir.us.davinci-deqm | Version: 5.0.0-ballot | |||
| Active as of 2024-08-27 | Computable Name: DEQM | |||
| Other Identifiers: OID:2.16.840.1.113883.4.642.40.23 | ||||
Copyright/Legal: Used by permission of HL7 International - Clinical Quality Information Work Group, all rights reserved Creative Commons License |
||||
The purpose of this implementation guide is to support value based care data exchange in the US Realm. However, this Implementation Guide can be usable for multiple use cases across domains, and much of the content is likely to be usable outside the US Realm.
Interoperability challenges have limited many stakeholders in the healthcare community from achieving better care at lower cost. The dual challenges of data standardization and easy information access are compromising the ability of both payers and providers to create efficient care delivery solutions and effective care management models. To promote interoperability across value-based care stakeholders and to guide the development and deployment of interoperable solutions on a national scale, the industry needs common information models and data exchange standards. The intent of the framework defined in this guide is to enable automatic data collection and submission limiting the need for manual processing and intervention. Ultimately, a national standard based on FHIR for data structure and exchange will reduce the burden on clinicians of transforming data between systems.
This Implementation Guide is supported by the Da Vinci initiative which is a private effort to accelerate the adoption of Health Level Seven International Fast Healthcare Interoperability Resources (HL7® FHIR®) as the standard to support and integrate value-based care (VBC) data exchange across communities. Like all Da Vinci Implementation Guides, it follows the HL7 Da Vinci Guiding Principles for exchange of patient health information. The guide is based upon the prior work from the US Core, QI Core, and HEDIS Implementation Guides and the QRDA Category I and III reporting specifications. Changes to this specification are managed by the sponsoring HL7 Clinical Quality Information (CQI) and Clinical Decision Support (CDS) workgroups and are incorporated as part of the standard HL7 balloting process.
This Guide is divided into several pages which are listed at the top of each page in the menu bar.
Home: The home page provides the introduction and background for the Clinical Quality Measures Ecosystem and The Data Exchange For Quality Measures.
Framework: These pages provide guidance on the set of FHIR transactions that provide a general framework to enable the exchange of measure data.
General Guidance gives overall guidance including preconditions, assumptions and an overview of the FHIR artifacts used in the different reporting scenarios.
Data Exchange gives guidance on the interactions between Consumers and Producers to exchange the data of interest for a measure.
Individual Reporting gives guidance on the interactions between Reporters and Receivers to exchange the individual reports for a measure.
Summary Reporting gives guidance on the interactions between Reporters and Receivers to exchange the summary reports for a measure.
Gaps in Care Reporting gives guidance on the interactions between Clients and Servers to exchange the Gaps in Care Reports for a measure. Note that Clients and Servers are defined in section 1.7.3. Gaps in Care Reporting Scenarios.
Use cases: Three* exemplar use cases are presented to demonstrate how to implement the DEQM framework for a particular measure.
Medication Reconciliation (MRP): This example shows how to implement a data exchange, and individual and summary measure reporting for the medication reconciliation post-discharge measure.
Colorectal Cancer Screening (COL): The colonoscopy measure is an example of a process measure evaluating screenings for preventive health services. Screening measures assess the number of eligible persons receiving clinical guideline recommended screening for all patients in the population receiving care during the measurement period.
Venous Thromboembolism Prophylaxis (VTE-1): This example is based on an existing CMS Eligible Hospital program measure (CMS108v7). It is an example of a process measure, using proportion scoring and is within the Preventative Care Meaningful Measure Area.
Gaps in Care: This page lists example use cases for Gaps in Care Reporting.
*Additional use cases and examples will be developed and made available here outside this implementation guide .
Profiles and Extensions: This page lists the set of Profile and Extension that are defined in this guide to exchange quality data.
Capability statements: This set of pages describes the expected FHIR capabilities of the various DEQM actors.
Examples: List of all the examples used in this guide.
Downloads: This page provides links to downloadable artifacts.
Terminology: This page lists code systems and value sets defined in this guide.
Operations: This page lists the Operation that is defined in this guide to exchange Gaps in Care Report.
As shown in step 1 in the diagram below, the Quality Improvement Ecosystem begins with information, preferably evidence-based from research, public health surveillance, and data mining and other analyses performed by third parties such as payers. Such information indicates existing status and knowledge about a given clinical topic. In step 2, stakeholders, such as professional societies, public health and governmental bodies, and healthcare insurers have various methods for publishing such information to assure awareness among consumers, healthcare practitioners, and healthcare organizations about what is known and suggested methods for managing the clinical topic. Ideally, suggested management efforts are captured and documented in guidelines based on collaboration among clinical subject matter experts, terminologists, informaticists, clinicians and consumers. In step 3, these clinical guidelines are translated into clinical decision support (CDS) artifacts to incorporate valuable clinical recommendations and actions directly within clinical workflow. To adequately impact clinical care for clinicians and patients requires local implementation activities as shown in Step 4. Ideally, the clinical guidelines and CDS include methods for evaluating what successful implementation means, i.e., whether the clinical care ultimately provided included processes that addressed the intent of the guideline and if it achieved the desired outcomes. In step 5, to close the loop and enable continuous improvement, the results of such measurement analytics must be reported for aggregate review. Step 6, "Reporting" serves the purpose of evaluating clinical performance and outcomes for healthcare organizations, for public health and for payers.
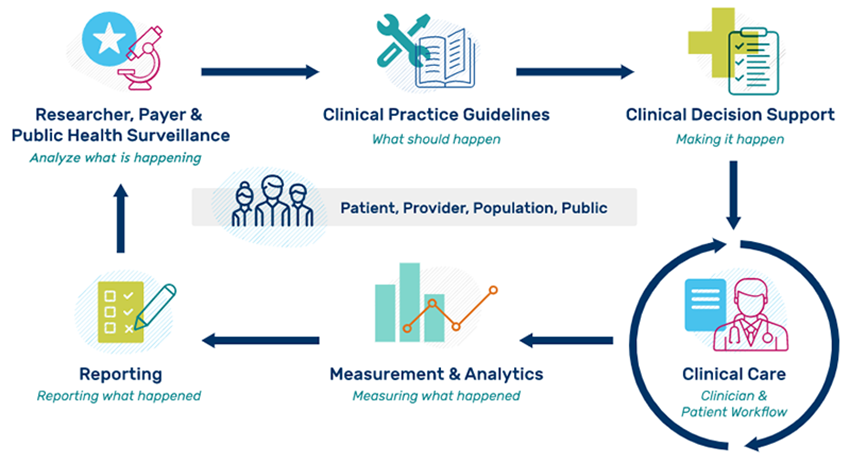
Stakeholders such as public health have ongoing needs for quality improvement at the point of care. Every effort should be made to establish a capable distributed rule processing environment in FHIR. For additional information about idealized processes for moving evidence and information from guidelines to CDS and measurement, refer to an effort by the Centers for Disease Control and Prevention (CDC) called Adapting Clinical Guidelines for the Digital Age.
This implementation guide is part of a larger FHIR-based quality improvement and quality measurement standards landscape, depicted in the following diagram:
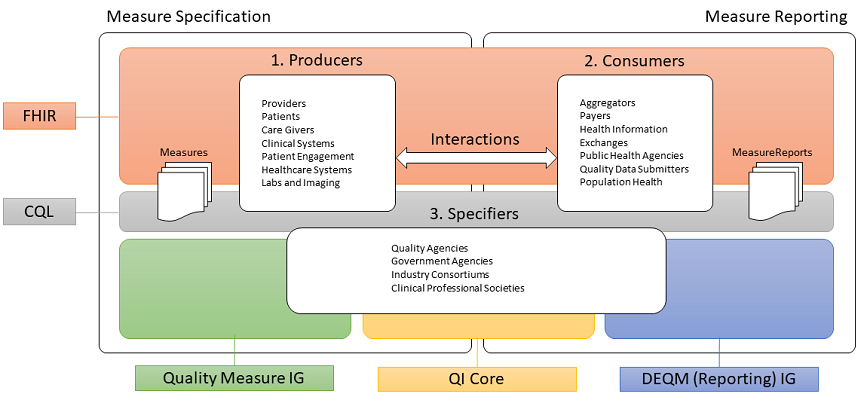
The left side of the quality measurement standards landscape diagram depicts the activities and standards associated with measure specification, while the right side depicts measure reporting. Stakeholders and the roles they play are represented by the three rounded rectangles in the foreground. Note that the lists are representative of typical stakeholders, but that a single stakeholder may play any or all of the roles in this diagram. For example, an institution specifying its own measures for internal use would be the Producer, Consumer, and Specifier.
Measure specification involves the end product of the measure development process, a precisely specified, valid, reliable, and clinically significant measure specification to support accurate data representation and capture of quality measures. Clinical quality measures (CQMs) are tools that help measure and track the quality of health care services provided in care delivery environments, including eligible clinicians (ECs), eligible hospitals (EHs), and critical access hospitals (CAHs). Measuring and reporting CQMs helps to ensure that our health care system is delivering effective, safe, efficient, patient-centered, equitable, and timely care. CQMs measure many aspects of patient care, including patient and family engagement, patient safety, care coordination, public health, population health management, efficient use of healthcare resources, and clinical process and effectiveness. For more information on the basics of Clinical Quality Measures, see Clinical Quality Measures Basics. Before Electronic Health Record (EHR) systems, chart-abstracted CQMs were predominant. Modern EHR systems enable electronic CQMs, or eCQMs.
Measure reporting involves the data collection and aggregation, calculation and analytics, and ultimately reporting of quality measures. Measure reporting may be accomplished in different ways at various levels of the healthcare delivery system, from individual providers attesting to specific quality measures as part of federally-regulated healthcare quality initiatives, to provider organizations reporting to healthcare plans as part of payer quality improvement activities, to institutions reporting on the quality of their own healthcare delivery.
Stakeholders in the quality space, represented by the three rounded rectangles in the foreground of the above diagram, fall into three broad categories:
Data Producers in the diagram represent the various stakeholders involved in the de novo creation of healthcare data. Data Producers can include providers and provider systems; patients, care teams, caregivers, and patient engagement systems; and other related clinical systems such as laboratory, clinic, and hospital information systems that are primary producers of patient healthcare information.
Data Consumers in the diagram represent the various stakeholders involved in the consumption and use of healthcare data. Data Consumers can include data routers and aggregators, payers, health information exchanges and health integrated networks, as well as public health and other healthcare-related agencies.
Specifiers in the diagram represents the various stakeholders involved in the specification of quality measures for use in healthcare quality measurement and reporting. Specifiers can include quality agencies, public health, and other healthcare-related agencies, industry consortiums concerned with improving care quality, and clinical professional societies. Specifiers may also be institutions and clinics using the quality measurement standards to specify quality measures for use in their own environments and quality improvement initiatives.
The shaded areas underlying the stakeholders depict the various standards involved (see Clinical Quality Framework for more information).
Fast Healthcare Interoperability Resources, or FHIR, is a Health Level 7 (HL7) platform specification for healthcare that supports exchange of healthcare information between systems. FHIR is universally applicable, meaning that it can be used in a broad variety of implementation environments. The platform provides layers of implementation that support foundational protocols; base implementation functionality such as conformance and terminology; administrative functionality to represent patients, care teams, locations, and organizations; healthcare processes including clinical and diagnostic information, as well as medication, workflow, and financial; and finally, a clinical reasoning layer that provides support for the representation of knowledge and reasoning about healthcare.
The quality measurement standards landscape makes use of all these layers of FHIR: the foundational and implementation layers to define interactions and profiles; the administrative and process layers to represent the data of interest for quality measurement; and the clinical reasoning layer to specify and support evaluation and reporting of quality measures.
Clinical Quality Language, or CQL, is an HL7 cross-paradigm specification that defines a high-level, domain-specific language focused on clinical quality and targeted for use by measure and decision support artifact authors. In addition, the specification describes a machine-readable canonical representation called Expression Logical Model (ELM) targeted at implementations and designed to facilitate sharing and evaluation of clinical knowledge.
This ability to render clinical knowledge in a high-level human-readable form as well as an intermediate-level, platform-independent machine-readable form makes CQL an ideal mechanism for specifying the criteria involved in quality measures.
The FHIR Quality Measure Implementation Guide defines conformance profiles and guidance focused on the specification of quality measures using the FHIR Measure and Library resources. The IG does not standardize the content of any particular measure, rather it defines the standard approach to the representation of that content so that quality measure specifiers can define and share standardized FHIR-based electronic Clinical Quality Measures (eCQMs).
The Data Exchange for Quality Measures Implementation Guide, or DEQM, (this ig) provides a framework that defines conformance profiles and guidance to enable the exchange of quality information and quality measure reporting (e.g. for transferring quality information from a health care provider to a payer). The DEQM expects to use quality measures specified in accordance with the Quality Measure IG and QI-Core.
The quality improvement ecosystem covers every aspect of the healthcare delivery system, and needs to be able to represent information across that entire spectrum. FHIR provides a foundation for representation of this information in a universally applicable way. In particular cases, more specificity is required to capture the intended meaning of healthcare information. As FHIR is more and more broadly adopted, consensus among participating stakeholders on the use of particular profiles and patterns enables semantic interoperability for more use cases.
Within the US Realm, US Core profiles comprise this base consensus, and although it enables a variety of interoperability use cases, the profiles do not represent all of the requirements for quality improvement. The QI-Core profiles are derived from US Core and provide this additional functionality.
There are occasional instances where additional specificity or functionality is required explicitly for quality measurement, or a particular component within a quality measure. In these cases, additional profiles are defined within the DEQM, or by stakeholders such as measure developers or implementers. For example, the Medication Reconciliation Post Discharge measure example included in this implementation guide references the Healthcare Effectiveness Data and Information Set (HEDIS) Implementation Guide, which defines profiles specific to that particular HEDIS measure.
The following diagram depicts this data model standards landscape:
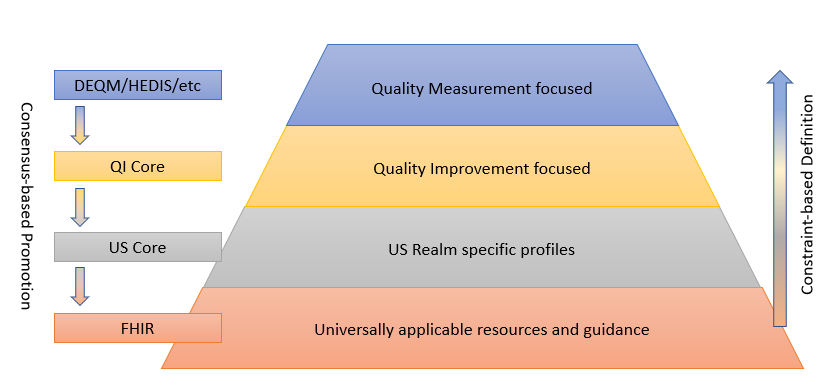
As illustrated, FHIR provides the foundation, and sets of profiles are built on top of FHIR that provide more and more focused use cases by constraining profiles and extending functionality to cover gaps. While the additional layers are necessary to represent specific operations and provide space for agreement among relevant stakeholders, the consensus-based standards development process is used to suggest changes to the layers below, resulting in an ever-broadening umbrella of interoperability.
This layering of profiles balances the relative adoption and implementation maturity of FHIR and the data representation requirements of the use cases involved, guided by the following principles:
There are three broadly used and fully published versions of the FHIR specification:
In addition to what data is reported, use cases frequently require the communication of when, where and how to report. See the Electronic Case Reporting (eCR) implementation guide for a more complete discussion of these design considerations. We are actively seeking feedback from implementers how this type of information is currently communicated in quality reporting scenarios and when it would be useful to do so electronically.
This implementation guide describes two groups of quality reporting scenarios as shown in Figure 1-4 below. The first group are Exchange Scenarios which focus on exchanging subsets of the data of interest for a particular measure or set of measures throughout the measurement period. Note that there are use cases for sharing data from a consumer to a producer as well (for example, payers may share screening information with providers). The Second group are Reporting Scenarios which focus on communicating the results of a quality measure at the end of a measurement period as part of a quality improvement initiative.
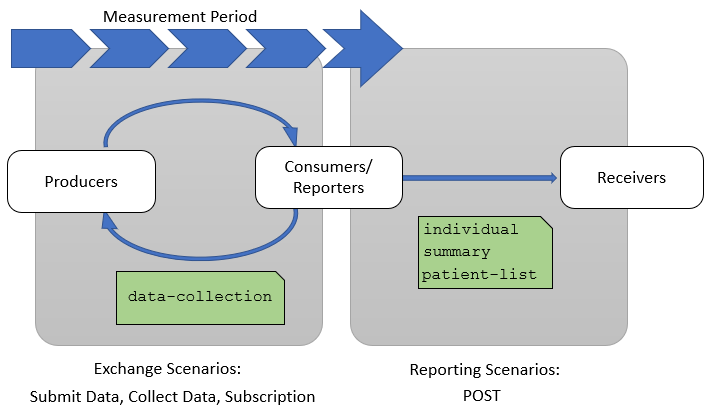
Exchange scenarios are used to exchange subsets of the data of interest for a measure or set of measures throughout the measurement period. These scenarios enable providers and quality stakeholders such as payers, accountable care organizations, and other secondary use partners to keep better track of how patients are performing with respect to a particular quality measure during the measurement period.
The three exchange scenarios are:
For these scenarios, the actors are Producers and Consumers, used in the same sense as the Producers and Consumers stakeholders in the Quality Measurement Standards Landscape diagram. Note that within any particular use case, different stakeholders will play the same roles. For example, a Provider may be playing the role of Producer in a particular exchange, while the Payer may be playing the role of Consumer.
Reporting scenarios are used to report the results of quality measures on patients or populations at the end of a measurement period. Measure reports are provided to attest the standard of care given to patients in a population as measured by specific quality measures. The measures are typically identified as part of a quality improvement program or initiative by a payer or other quality improvement stakeholder such as Public Health with use cases that are typically more focused on the reporting scenarios.
The reporting scenarios are:
For the reporting scenarios, the actors are Reporters and Receivers:
Reporters are the actors submitting the results of a quality measure. Depending on the reporting requirements for a particular scenario as well as the technical capabilities of the systems involved, the reporter may be different stakeholders such as providers, provider organizations, aggregators, or payers.
Receivers are the actors receiving the results of quality measures. Again, depending on the reporting requirements and technical capabilities, receivers may be different stakeholders, but are typically aggregate-level stakeholders such as healthcare agencies, payers, and quality improvement organizations.
Gaps in Care Reporting is a reporting scenario supported in this implementation guide. Similar to the quality reporting scenarios, a Gaps in Care Report is used to report the results of quality measures on patients or population, but for a gaps through period that is of interest for a Client.
The process below can be run as many times as useful during the reporting period to assure that all open gaps are closed.
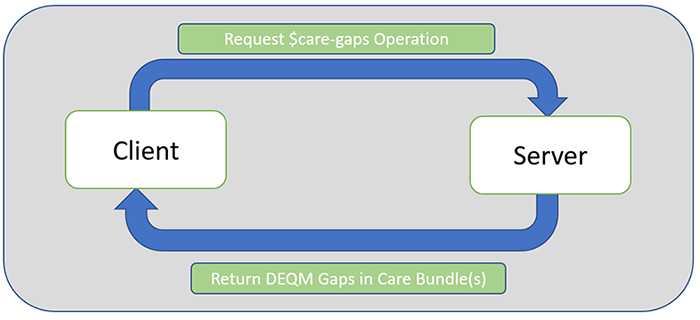
For the Gaps in Care Reporting Scenarios, the actors are Clients and Servers.
Clients are the actors requesting gaps in care results of quality measure(s). Depending on the reporting requirements for a particular scenario as well as the technical capabilities of the systems involved, the clients may be different stakeholders such as providers, provider organizations, aggregators, or payers. For example, if a provider requests a report from the payer's system, then the provider serves as the client. If a payer requests a report from their own system, they are the client.
Servers are the actors receiving the request for the Gaps in Care Report and producing it based on the information they have in their system. Again, depending on the reporting requirements and technical capabilities, receivers may be different stakeholders, but are typically aggregate-level stakeholders such as healthcare agencies, payers, and quality improvement organizations. For example, if a provider requests a report from the payer's system, then the payer's system serves as the server. If a payer requests a report from their own system, the payer's system serves as the server.
Measure.effectivePeriod).For additional definitions see the eCQI Resource Center Glossary
| Acronym | Definition |
|---|---|
| API | Application Program Interface |
| CDS | Clinical Decision Support |
| CMS | Centers for Medicare and Medicaid Services |
| COL | Colorectal Cancer Screening Measure |
| CQFM | Clinical Quality Framework Measures |
| CQL | Clinical Quality Language |
| CQM | Clinical Quality Measures |
| DEQM | Data Exchange For Quality Measures |
| eCQM | electronic Clinical Quality Measures |
| EHR | Electronic Health Record |
| FHIR | Fast Healthcare Interoperability Resources |
| GIC | Gaps In Care |
| MRP | Medication Reconciliation Post-discharge Measure |
| QDM | Quality Data Model |
| R4 | FHIR Release 4 |
| REST | Representational State Transfer |
| STU3 | FHIR Release 3 (STU) |
| VTE-1 | Venous Thromboembolism Prophylaxis Measure |
This Implementation Guide was made possible by the thoughtful contributions of the following people and organizations: